Nutrient Regulation On Streams: The Macrophyte Quandary
John C. Hall, William T. Hall
Published in the November/December 2007 issue of the Watershed & Wet Weather. Download the original article here.
Published in the November/December 2007 issue of the Watershed & Wet Weather. Download the original article here.
Since promulgation of the Clean Water Act in the 1970s, the nation's water quality has improved dramatically. Current water quality concerns are rarely attributed to excessive loads of carbonaceous and nitrogenous biochemical oxygen demand. Rather, the largely uncontrolled discharge of nutrients from point and nonpoint sources has resulted in the anthropogenic eutrophication of many Jakes and streams. The U.S. Environmental Protection Agency (EPA) recognizes such eutrophication problems as the most pervasive water quality problem facing the nation, has developed guidance for states to develop nutrient criteria, and is pressing states to develop total maximum daily loads (TMDLs) to achieve designated uses.
Eutrophication problems in streams are dramatically more complex. Due to the short residence time associated with flowing water bodies, phytoplankton are often not a significant concern. Rather, periphyton (fixed plant growths on submerged surfaces) and rooted aquatic growths pose the greatest potential problems for use impairment. The growth kinetics and nutrient requirements of these fixed plants is not well understood. Unlike lakes, extremely low levels of nutrients in streams may still result in high plant growth if other physical conditions are favorable. Consequently, the ability to control such growth through point source regulation is questionable.
This problem is exemplified by the situation m Upper East Canyon Creek in Park City, Utah. Land development in the drainage area resulted in a significant reduction in the trout population that was attributed, in part, to extensive rooted macrophyte growth. This, in turn, caused excessive diurnal dissolved-oxygen (DO) swings, dropping DO levels below the state's minimum requirements. Because the problem was associated with rooted macrophytes, a model was not developed to predict the nutrient levels necessary to achieve water quality standards. Rather, the wastewater treatment plant (WWTP) was required to drastically reduce its phosphorus load so that the stream's phosphorus concentration dipped to 0.05 mg/L during the growing season, with the hope that macrophyte growth would be reduced. Consequently, a simplified mixing model was used to calculate the WWTP load necessary to achieve a 0.05 mg/L instream target. While expensive upgrades were made to the facility to achieve the instream target, plant growth remains unchanged. As discussed below, similar results are expected to occur throughout the country unless EPA rethinks its position regarding nutrient regulation in streams.
East Canyon Creek
The East Canyon Creek watershed drains 373 km2 (144 mi2) of mountainous terrain from its headwaters to the East Canyon Creek Reservoir. East Canyon Creek is classified as a Class 3A stream (cold-water fishery) with additional designated uses, including drinking water supply, secondary contact recreation, and agricultural use. The DO standard for Class 3A streams is a multipart standard based on a 30-day average of 6.5 mg/L, as well as 7-day (5.0 mg/L minimum) and I-day (4.0 mg/L minimum) requirements.
Since 1980, the local population has grown dramatically. As a result, base flow to the stream has steadily decreased over the years, reducing the habitat area and decreasing the creek's assimilative capacity. The Utah Division of Wildlife Resources documented a substantial decline of wild trout populations ranging from 46% to 80% between 1988 and 1993. Development has also contributed a significant amount of finer-grade sediment to the streambed. These sediments have, provided a rooting medium for macrophytic plant growth as well as a heavy load of particulate phosphorus. With limited available shade, these developments have contributed to the extensive growth of rooted aquatic macrophytes over long stretches of the stream, both above and below the WWTP. The decay of macrophytes' excess organic material and their photosynthesis-respiration cycle cause DO levels to fall well below state standards. These effects are exacerbated by declining streamflows.
The stream was originally placed on the Utah Department of Environmental Quality Division of Water Quality (DWQ) Sec. 303(d) list of impaired waterbodies in 1992 for total phosphorus and DO. DWQ does not have a water quality standard for total phosphorus but has adopted 0.05 mg/L as a "target" value to avoid nutrient enrichment in streams. The TMDL implies that this value was derived from EPA's 1976 Quality Criteria for Water, which suggests that total phosphates should not exceed 0.05 mg/L in any stream at the point it enters a lake to prevent biological nuisances and to control accelerated or cultural eutrophication. (The recommended stream "criterion" was actually 0.1 mg/L.) The criteria document also noted that stream impacts and needs are site-specific, affected by a number of physical variables, such as light (shading), temperature, and scour. Thus, it was acknowledged that greater or lesser nutrient reduction might be necessary to prevent nuisance plant growth. No insight was given on how to address macrophyte growth that typically derives nutrients from the sediment bed.
Basis for TMDL and TMDL Endpoints
With assistance from an EPA contractor, a TMDL was prepared in 2000 by DWQ. DO was identified as the primary water quality standard impairment. The TMDL presumed that modifying surface water concentrations of phosphorus would, in turn, reduce the growth of rooted macrophytes and reduce diurnal DO variations. The Snyderville Basin Water Reclamation District WWTP discharges at a point that drains approximately 130 km (50 mi2; two-thirds of the drainage area is downstream of the point source). The TMDL targeted the WWTP for significant reductions in total phosphorus load, as it was the only point source on the creek.

The TMDL identifies eight implementation measures that may be divided into three categories. The first category, phosphorus reduction, is addressed by six of the implementation measures. These measures include an upgrade to the WWTP to optimize phosphorus removal, stormwater control programs to minimize phosphorus and sediment loads, nutrient management plans (for golf courses and parks), and a nutrient loading study. The second category, stream channel restoration, recommends BMPs to restore natural shading and improve channel conditions. The third category involves water quality monitoring to evaluate the effect of the implementation measures on water quality and restoration of designated uses. As described, the primary focus is on reducing phosphorus even though the success of this approach was uncertain.
Progress After TMDL Adoption
Certain parameters after the TMDL was adopted were studied, most notably phosphorus, macrophyte coverage, and dissolved oxygen levels.
Phosphorus
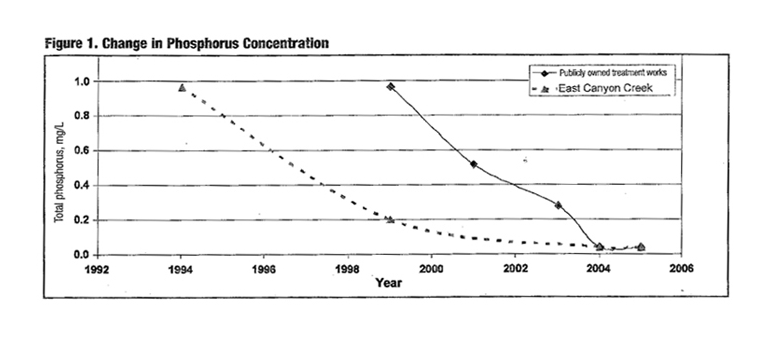
The WWTP has gone through two upgrades since 1992, at a cost exceeding $12 million. Before biological phosphorus removal was installed in 1996, effluent total phosphorus ranged from about 3 to 5 mg/L. Since the upgrade, effluent phosphorus decreased to about 1 mg/L (a 75% reduction). In early 2003,chemical phosphol1ls removal with filtration was added to yield a total phosphorus concentration below 0.1 mg/L.
Treatment plant performance for the growing season (June to October) is significantly better than for the nongrowing season (November to May). After chemical treatment and filtration was added, summer phosphorus levels dipped as low as 0.03 mg/L - that is, effluent quality from the treatment plant exceeds the TMDL endpoint by 40% in the summer. The effluent quality now mirrored that of the waters upstream of the facility (see Figure 1).
Macrophyte Coverage
DWQ conducted macrophyte surveys of East Canyon Creek in 2004 and 2005. Both studies evaluated 11 specific locations and characterized the percent macrophyte coverage as well as the predominant species present Stream characteristics, including substrate, water velocity, water depth, DO, and temperature, were also recorded. As noted by BIO-WEST in 1999, three predominant macrophyte species were observed during these surveys: Ranunculus aquatilus (river buttercup), Potamogeton crispus (curly pondweed), and Potamogeton pectinatus (sago pondweed).
DWQ conducted macrophyte surveys of East Canyon Creek in 2004 and 2005. Both studies evaluated 11 specific locations and characterized the percent macrophyte coverage as well as the predominant species present Stream characteristics, including substrate, water velocity, water depth, DO, and temperature, were also recorded. As noted by BIO-WEST in 1999, three predominant macrophyte species were observed during these surveys: Ranunculus aquatilus (river buttercup), Potamogeton crispus (curly pondweed), and Potamogeton pectinatus (sago pondweed).
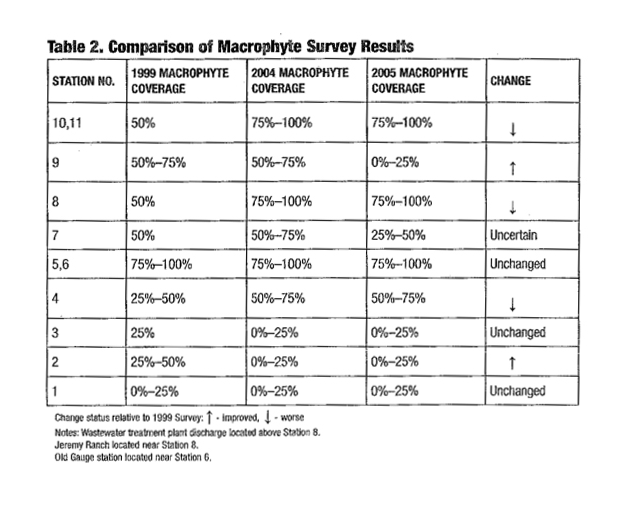
For example, Station 9 (upstream of the outfall) experienced a very significant decrease in macrophyte coverage (from a range of 50% to 75% in 2004 to a range of zero to 25% in 2005). It was characterized as having a cobble-gravel bottom in 2004 and a cobble-silt bottom in 2005. Station 7, 2.4 km (1.5 mi) below the WWTP, was observed with 50%-75% macrophyte coverage and a substrate of gravel with some cobble in 2004, while in 2005 it was characterized with 25%-50% macrophyte coverage and a substrate of gravel-silt. Based on these descriptions it would seem that the substrate quality has declined with a resulting decrease in macrophyte coverage. However, given the increase in silt, macrophytes would be expected to recolonize the bare substrate.
In addition, these surveys reported the presence of Cladophora, a filamentous green algae, at six sites in 2004 and indicated it was the dominant species at Site 1 (about 11.3 km, or 7 mi, below the WWTP) and Site 9 (above the WWTP). Given the occurrence of tills "nuisance" plant species above and below the WWTP, it is apparent that the facility is not controlling its occurrence. Although the phosphorus concentration remained essentially identical the following year, the 2005 survey found the level of Cladophora greatly reduced, with the algae only reported at Site 5 (about 4.8 km [3 mil below the
WWTP). This reduction between 2004 and 2005 is unexplained, but it cannot be attributed to changes in phosphorus concentration. The disappearance of Cladophora upstream of the outfall (Station 9) at the time suggests other factors are affecting it. The random occurrence and disappearance of this "nuisance" plant growth has been documented in other high quality waters.
Dissolved Oxygen
Diurnal DO concentrations have been measured several times for 10 years at several different locations. Direct comparison of these measurements is of limited use because of the multiple factors that affect DO concentration. These factors include flow, temperature, reaeration rate, which is a function of flow, biochemical oxygen demand, sediment oxygen demand, and aquatic plant photosynthesis and respiration. Several factors are assumed to be relatively unchanged from previous years or relatively unimportant (biochemical oxygen demand, sediment oxygen demand). For other factors there is relatively limited information (historical flow data). Nonetheless, it is apparent that phosphorus reductions have had no material effect on altering the diurnal DO variation. This would be expected since no material change in plant coverage was observed.
Above the WWTP
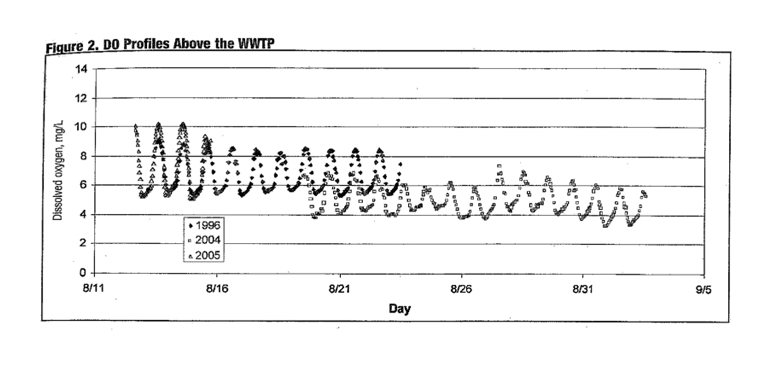
Diurnal DO was measured immediately upstream of the WWTP outfall in 1996,2004, and 2005. The measurements in 2004 and 2005 also included temperature observations from which DO saturation concentration could be calculated. Saturation values for 2004 and 2005 show nearly identical minimum saturation concentrations of about 7 mg/L. Similarly, maximum saturation concentrations ranged between 8 and 9 mg/L. The DO profiles observed at this station are illustrated in Figure 2 (above). The difference between the DO profiles in 2004 and 2005 is not due to the saturation concentration. Rather, it appears to be due to differences in the flow rate. Streamflow during the 1996 and 2005 surveys was 0.40 m3/s and 0.45 m3/s (14.3 ft3/s and 16 ft3/s), respectively. The flow during the 2004 survey was significantly lower, 0.19 m3/s (6.6 ft3/s). The difference in flow is the only known difference between the 2004 and 2005 surveys. It is also apparent from Figure 2 that the DO range is significantly higher in 2005 than in previous years. This increase in range suggests an increase in photosynthetic activity in comparison with 1996 and 2004.
Below the WWTP (Old Gauge)
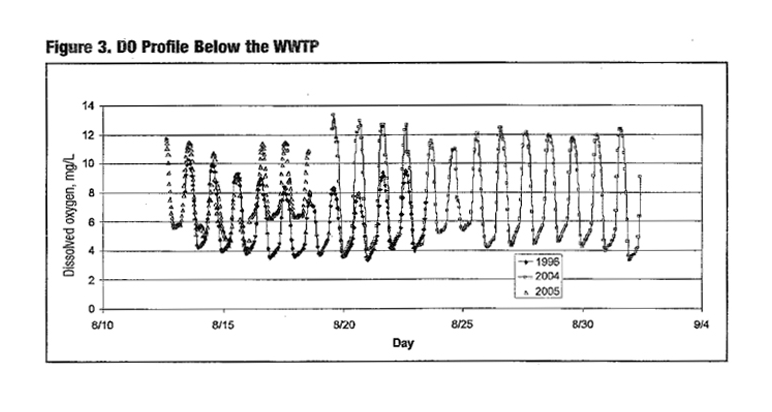
This station, located several miles below the WWTP discharge, has the most complete database for flow, DO, and total phosphorus concentrations. Measurements were made at Old Gauge in 1996,2004, and 2005. The measurements in 2004 and 2005 also included temperature observations from which the DO saturation concentration could be calculated. The DO saturation values for 2004 and 2005 are similar. The DO profile observed for the station is illustrated in Figure 3. The DO profiles in 1996 and 2005 were similar, while the 2004 diurnal profile exhibits a much greater range. The minimum DO observed during each of these monitoring periods is essentially identical, in particular for the 1996 and 2005 periods when the streamflows were similar. Between these two monitoring events, the phosphorus regime changed significantly. However, the improvement in nutrient concentration was not reflected in the DO profile. The broader DO range observed in 2004 was likely caused by the difference in flow compared with the 2005 monitoring period.
Have These Changes Worked?
The premise behind the TMDL action was that reductions in total phosphorus concentration would result in reduced macrophyte growth and consequently
reduce the DO variation associated with photosynthetic activity. Since the TMDL was adopted in 2000, there have been significant improvements in the level of total phosphorus downstream from the WWTP discharge. In 2004 and 2005, total phosphorus concentrations below the WWTP have achieved or bettered the target concentration of 0.05 mg/L established in the TMDL. Upstream and downstream total phosphorus concentrations are, for all practical purposes, now identical.
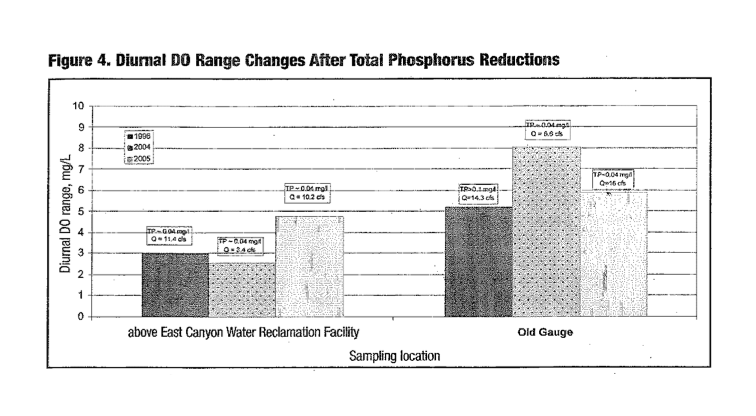
Since chemical phosphorus removal was added in 2003, reduced total phosphorus levels in the stream (in compliance with the TMDL target) would have been in effect for at least a year and a half 1bis should be a sufficient amount of time to impact macrophyte coverage if surface water phosphorus concentration was a controlling factor in macrophyte growth. Despite this very significant change in nutrient levels, water quality standards were not achieved in 2004, above or below the WWTP, when stream flows were reduced. In 2005, under much higher flow conditions, the DO water quality standards were achieved above and below the WWTP. A comparison of the diurnal DO profiles in 1996, prior to nutrient control, with those in 2004 and 2005 (summarized in Figure 4) confirm that significant reductions in macrophyte growth have not occurred in response to the decrease in total phosphorus. This inference, from the DO data, is confirmed by the spot observations of macrophyte coverage conducted by the DWQ. Consequently, it would appear that other factors are controlling the macrophyte growth in East Canyon Creek, as suggested by the 1999 BIO-WEST report. These other factors include flow, shading, and channel characteristics.
John Hall is the president and William Hall is an associate at Hall & Associates in Washington, D.C.
Published in the November/December 2007 issue of the Watershed & Wet Weather. Download the original article here.
Published in the November/December 2007 issue of the Watershed & Wet Weather. Download the original article here.
